概括
[TakinghistoryasamirrorhowcanUSbondinterestratesrisetotriggeracorrectioninUSstocks?】RecentlytherapidriseofUSTreasuryinterestrateshascausedmarketconcernsSincethebeginningoftheyearthe10-yearUSTreasuryinterestratehasrisenbymorethan40bpandcurrentlyreaches134%AsthepricinganchorforglobalassetswillthesurgeinUSbondinterestratesinashortperiodoftimecauseacorrectioninthestockmarket?Thisarticleattemptstofindoutfromhistory(ChuanyueGlobalMacro)
Recent U.S. debtinterest rateThe rapid upward movement triggeredmarketWorries, 10-year US debt since the beginning of the yearinterest rateThe uplink exceeds 40bp and currently reaches 1.34%.As a global assetPricingAnchorinterest rateWill the surge in a short period of time cause a correction in the stock market? This article attempts to find out from history.
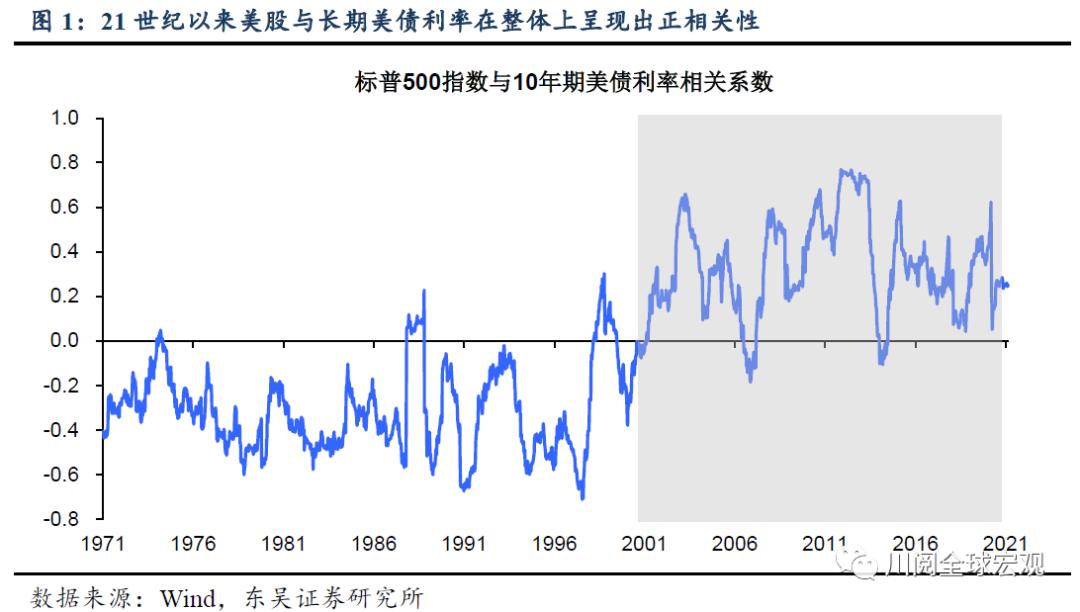
Since the 21st century, the rise in U.S. stocks has often been accompanied by the rise in U.S. bond interest rates.U.S. stocksinvestmentChanges in income and U.S. Treasury interest rates showed a positive phase overall.This is the same as what the two showed in the 1970s and 1990sNegative correlationSex is very different (Figure 1).

Why does the correlation between US stocks and US debt interest rates undergo structural changes in the early 21st century?The answer lies in inflation, as shown in Figure 2. Since the 21st centuryMidlandStored incurrencyThe policy is more focused on stabilizing inflation, the US economy is overheatedriskSignificantly lower, so the upward trend of U.S. bond interest rates often reflects the economic growth prospects.improveAnd the moderate rebound in inflation, this macro environment is also positivestockrise.

It’s worth noting that infinancial crisisLater, the interest rate of the 10-year U.S. TreasuryInflation expectationsCloser (Figure 3).This means that the 10-year U.S. debt in the same periodReal interest rateIt is basically stable and at a relatively low level.

So, what kind of rise in U.S. bond interest rates will cause U.S. stocks to pull back? After combing through the history of the financial crisis, we found that there were only two periods. In these two periods, the U.S. Treasury interest rate rose while the U.S. stocks corrected, which occurred in the middle of 2013 and the beginning of 2018:
From May to June 2013, U.S. stocks corrected 6%, during which U.S. bond interest rates rose by 63bp (Figure 4).This time the rise in U.S. bond interest rates can trigger a correction in U.S. stocks becauseMidlandThe Reserve Bank released the “cutting panic” triggered by the QE exit signal. We noticed that this wave of 10-year U.S. Treasury interest rates was completely driven by the surge in real interest rates, and the real interest rate rose by 98bp over the same period (Figure 5)! This also means that inflation expectations over the same period have fallen.

From January to February 2018, U.S. stocks retreated 10%, during which U.S. bond interest rates rose by 40bp (Figure 6).This time the rise in U.S. bond interest rates triggered a correction in U.S. stocks because ofMidlandChu’s hawkish signal. At that time, the Fed believed that the US economy was recovering strongly, leading the market to continue to shrink the balance sheet and raise interest rates four times throughout the year. This wave of U.S. bond interest rates is also mainly driven by the rise in real interest rates. In the same period, real interest rates have risen by 30bp, which means that inflation expectations have only increased by 10bp (Figure 7).

Therefore, judging from the historical experience after the financial crisis, if the U.S. bond interest rate rises to trigger a correction in U.S. stocks, it is necessary to see the real interest rate rises unexpectedly.currencypolicyMarginalSigns of tightening.
Different from the two historical periods mentioned above, this round of U.S. bond interest rate increases was mainly driven by the rebound in inflation expectations for most of the time (Figure 8), especially before it broke 1.3% on February 16. 70% is contributed by the rebound in inflation expectations, and US stocks continue to hit new highs. However, after the 10-year U.S. Treasury interest rate broke 1.3%, inflation expectations turned down, and the accelerated recovery of real interest rates drove the U.S. Treasury interest rate to rise further (Figure 9).
Based on the above analysis, we believe that after the 10-year U.S. Treasury rate breaks 1.3%, we must pay attention to the trend of real interest rates.
That is, if the interest rate of the 10-year U.S. Treasury continues to rise, it is driven by the rise of real interest rates, indicating that the market is beginning to worry about the FedMonetary PolicyTurning earlier, the risk of US stocks’ correction will also increase significantly.
Conversely, if U.S. Treasury interest rates are rising driven by a rebound in inflation expectations, it does not constitute a risk of a correction in U.S. stocks, because from an absolute level, the current 2.2% inflation expectation still has room for upside from the Fed’s 2.3%-2.5% consensus range ( Figure 10).

(Source: Sichuan Read Global Macro)
(Editor in charge: DF387)
Solemnly declare: The purpose of this information released by Oriental Fortune.com is to spread more information and has nothing to do with this stand.
